OPC UA Wireshark Trace Analysis
Workshop Handout
1 Preparation
1.Install software
a.Wireshark
b.UA Expert
2.Copy files
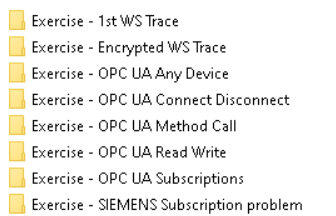
a.Exercises
b.Handout
c.OPC UA Filter
3.Connect the Laptop with the HUB using network cable
4.Configure for the ETH interface
a.Start -> Enter ‘network’ -> ‘View network connections’
b.Right click on the ETH interface -> ‘Properties’
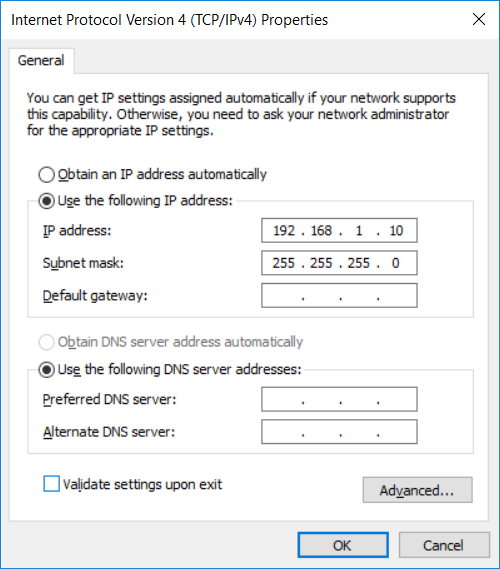
c.Select ‘Internet Protocol Version 4 (TCP/IPv4) and click on ‘Properties’
d.Configure the IP address
i.PC1: 192.168.1.10 // 255.255.255.0
ii.PC2: 192.168.1.20 // 255.255.255.0
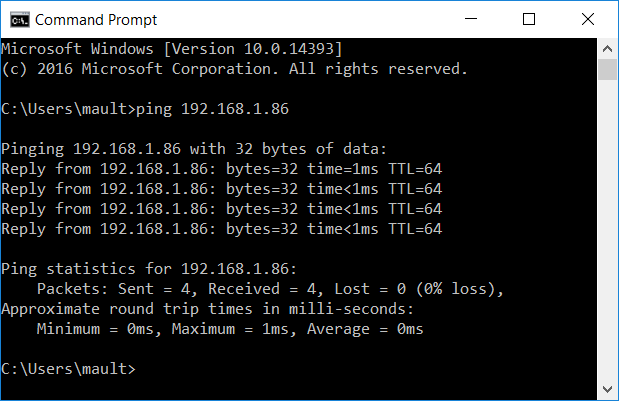
5.Test via ‘ping’ command if communication to the plc is possible
a.Start -> cmd -> ‘Command Prompt’
b.Enter ‘ping 192.168.1.86’
2 Exercise 1: WS Trace of OPC UA connection
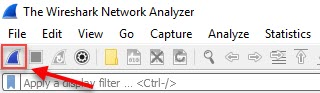
1.Open Wireshark and select the network interface to capture from
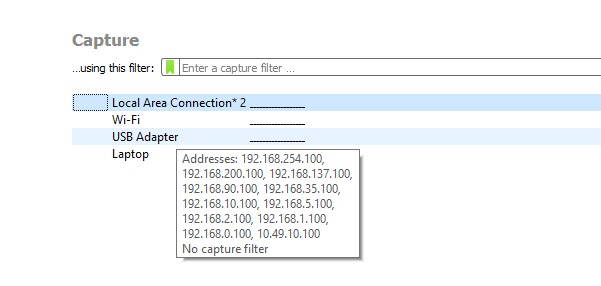
2.Click on ‘Capture’ -> ‘Start’
3.Open UA Expert
a.If it is the first time you open the tool, you have to create a certificate first.
It does not matter what you enter
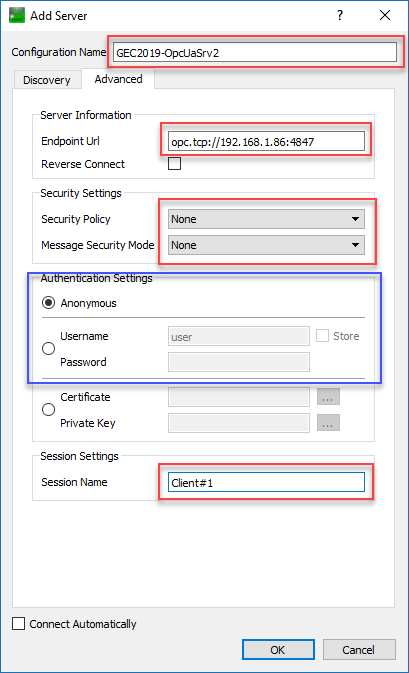
4.Add a new OPC UA server via ‘Server’ -> ‘Add’
a.Enter a ‘Configuration name’
b.Enter the ‘Endpoint Url’
c.Configure ‘Security Settings’
d.Configure ‘Authentication Settings’
i.Username: user
ii.Password: user
e.Enter a ‘Session Name’
5.Connect to the OPC UA Server
Select ‘Server’ -> ‘Connect’
Accept the server certificate for this OPC UA connection
6.Disconnect from the OPC UA Server
Select ‘Server’ -> ‘Disconnect’
7.Stop the capturing packets in Wireshark
Select ‘Capture’ -> ‘Stop’
3 Wireshark profiles and filters
1.Create a new profile called ‘OPC UA’
a.Select ‘Edit’ -> ‘Configuration Profiles’
b.Click on ‘Default’ and click on the ‘Copy this profile’ button
c.Enter a name for it – e.g. ‘OPC UA’
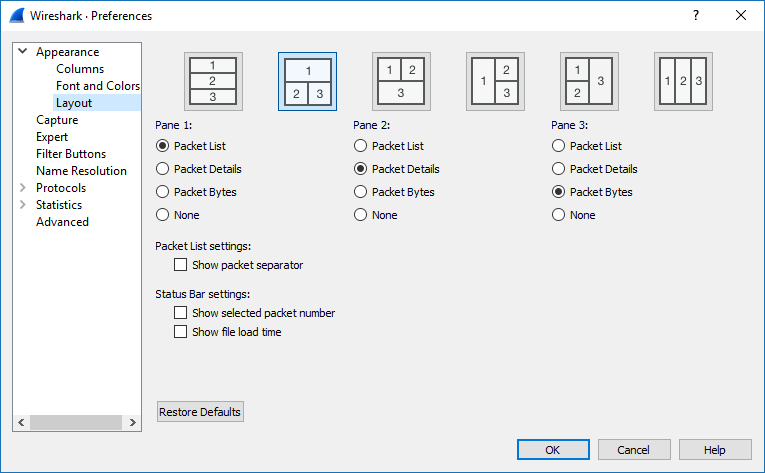
2.Change the layout of the Windows
a.Click on ‘Edit’ -> ‘Preferences...’
b.Select ‘Layout’ and use the 2nd Windows layout
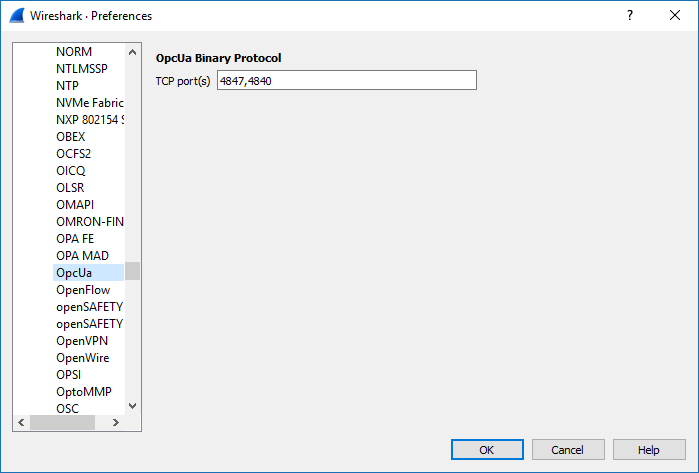
3.Set port for OPC UA connection
a.Select ‘Edit’ -> ‘Preferences...’
b.Select ‘Protocol’ -> ‘OpcUa’ -> Enter 4847
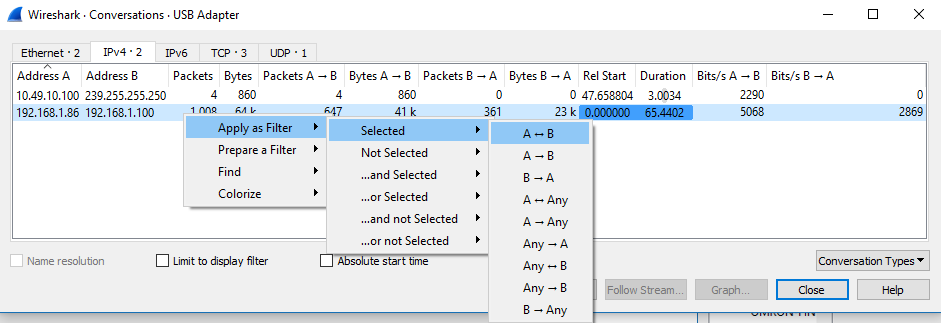
4.Filter the communication to your IP address and the server
a.Select ‘Statistics’ -> ‘Conversations’
b.Right click on the entry with your IP address and the server IP address 192.168.1.86
c.‘Apply as Filter’ -> ‘Selected’ -> ‘A<->B’
5.Filter only the OPC UA packets
a.Enter in the filter field behind the IP address filter -> ‘&& opcua’
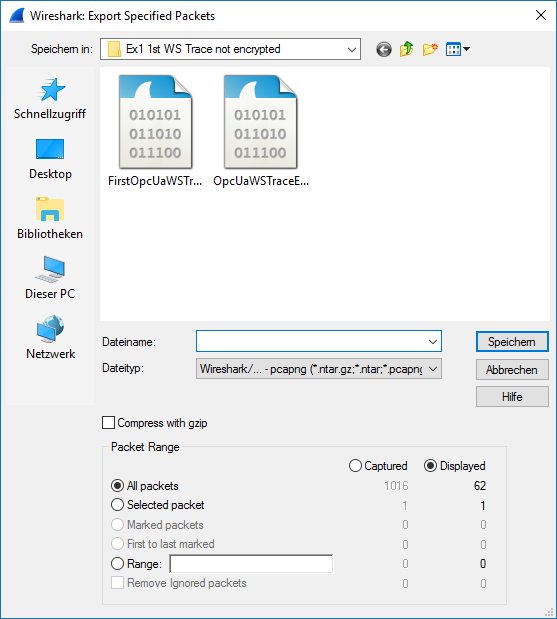
6.Save displayed packets in a file
a.Select ‘File’ -> ‘Export Specified Packets...’
4 Wireshark filter Endpoints / Conversation
1.Click on ‘Statistics’ -> ‘Endpoints’ to get an overview of all participants in the network of the WS trace.
2.Click on ‘Statistics’ -> ‘Conversations’ to get an overview which participants talk with each other.
3.You already set a filter for a certain IP address or a conversation between two endpoints by right clicking on an IP address -> ‘Apply as Filter’ -> ‘Selected’
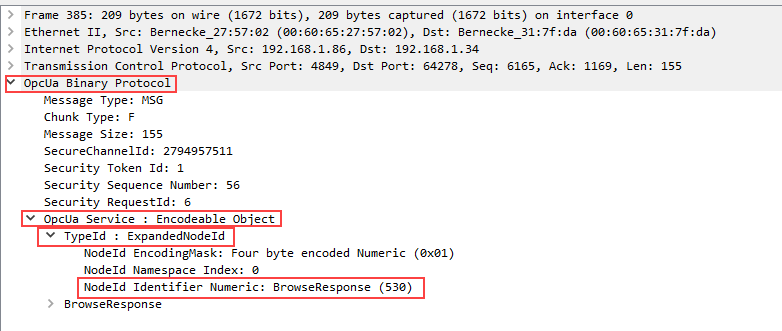
5 Wireshark filter OPC UA services
Each OPC UA packet of type ‘MSG’ has a child element ‘OpcUa Service : Encodable Object’ -> ‘TypeId : ExpandedNodeId’. Here you can right click on the NodeId of the respective service and apply a filter for that service.
Alternatively copy the respective filter of an OPC UA service from the file ‘OpcUaWSFilter.xlsx’.
不同情况下的抓包数据示例
下载内容